Skip to content
2016 Data Storytelling Studio @ MIT
Menu and widgets
Home
Outline
Syllabus
Lecture Slides
Readings
Datasets
About
Previous Image
Next Image
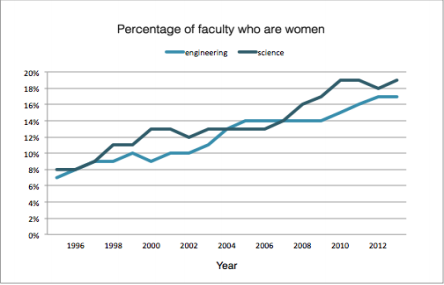
Example Graph
Graph found in the MIT Report
Post navigation
Published in
Methodology for Diversity at MIT: Step Up to the Board