Link to our final project here: Today’s Lecture: Gender Disparity at MIT
Team Members: Kenneth Friedman, Phillip Graham, and Andrew Mikofalvy
How we found our data:
Our group was interested in finding a dataset that related to education and academia. We decided to focus on MIT and found two reports that interested us:
A Study on the Status of Women Faculty in Science at MIT – Written in 1999
Which discussed the lack of women faculty in the Department of Science at the time (Around 8% for 10-20 years), gender discrimination with space, resources, equipment, and more, and the actions the Dean of MIT took to address these issues.
The Status of Undergraduate Women at MIT – Released by Caroline Chin and Kamilla Tekiela in February of 2016
Which discusses in great detail data collected through several surveys conducted by the MIT Office of Institutional Research, several campus focus groups, and the support of many more, which showed gender discrimination on campus today and recommendations to fix these issues moving forward.
How we cleaned it:
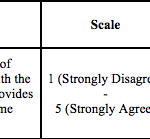
Data in The Status of Undergraduate Women at MIT report took the form of tables of questions from surveys and their resulting responses, graphs, and charts (one of which we had to extrapolate our data from).
For example:
How we analyzed it:
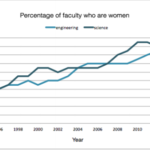
We analyzed the data by comparing survey answers between men and women looking for significant differences in responses, and compared a graph that shows the percentage of women faculty and undergraduate women over the past decade to the actual 50% of the population being women.
How we synthesized it into a story:
After reading through the 70 page report, our group decided to create an interactive exploration of the data in the report to show the issues associated with the lack of diversity on campus and gender discrimination.
The report on Undergraduate Women at MIT separates the findings into 3 categories:
Academics and Leadership, Environment, and Confidence and Stress.
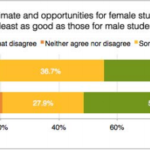
We decided to have our audience answer three questions in the form of interactive visuals, by using one question and result from each category. We chose one from each category to show the breadth of gender inequality covered in the report.
This design decision was inspired by You Draw It by The New York Times to allow our audience to use their best judgement to guess at what the results of the survey showed. Then the user is shown the results of said survey so that the audience can compare their answer.
After seeing the each result, a corresponding recommendation is shown on what MIT can do to help solve the issue in the question.
For example, closer relationships with advisors can be advisor/advisee dinners hosted by the department.
Our story closes with our Call to Action being, we invite the audience to write a note to MIT’s new Vice President for Student Life, Suzy Nelson, discussing gender discrimination the audience may have either noticed previously or become aware of due to our project, and suggest her to look into the recommendations in the report on Undergraduate Women at MIT.
Another design decision we made was to use the Blackboard as the basis for our interactive visual. The academic tone it sets, alongside the title, is supposed to feel like an interactive lecture, similar to solving problems in MIT classes that are TEAL (Technology Enabled Active Learning) where students are writing on boards to solve problems during lecture. We wanted our audience to feel like they are participating in solving these issues on campus.
