Whispers of Freedom

By: Reem Al-faiz, Jyotishka Biswas, Mike Drachkovitch, Argyro Nicolaou, and Felipe Lozano-Landinez

For our final project, we decided to tackle the thorny civic issues of empowerment and gender equality, with the focal point being the realities faced by the Saudi women community today (you can see our final presentation slides for class here). At the core of it was a survey-interview audio dataset in which Saudi women answered a set of questions related to the aforementioned civic issues. We presented the data set primarily through an art exhibit but also through digital platforms like a website and video. We conducted interviews at the exhibit to assess the impact of our work, and gained valuable feedback for future iterations. 

Our Audience for this project was Massachusetts School of Art and Design students and faculty. There currently is a serious conversation at MassArt about equality, between genders and with other communities, and we decided that this would be a good audience to interface with the Saudi women data set. The Goals were to give voice to Saudi women and to allow Mass Art students and faculty to engage in a conversation around gender equality. Our Call to Action was to ask MassArt students and faculty to share their voice and stand in solidarity with Saudi women; they could do this by recording their own message (whether via interview or post-it) in which they answered the question What is one thing missing in your life that you believe would empower you?”. This gesture of solidarity is a manifestation of an engaged audience for the issues that Saudi women voice, changing the dynamic of their current reality in which these voiced issues are not heard. While this Call to Action is considerably different than other calls to action that we have been exposed to in the course, we believe it is the appropriate one because of the sensitivity of the subject matter and the dynamics of an art exhibit-data sculpture combination. We didn’t want to have a call to action that in any way co-opted the voices of the women, implied that we or our audience “knows better”, or “imposed help”.  


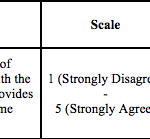
The data set was collected via a survey of twenty-six (26) quantitative and qualitative questions related to the topic of empowerment, distributed via Twitter and Path. Over 500 answers were received in a few days, 75% of them from women. One of the questions, “What are you currently lacking that would make you more empowered?”, received a high volume of answers that talked about freedom, independency, more choices and confidence in their choices. The audio files (our final data set) that we ended up using represented a subset of these answers; they were the responses that were longer (not one word), not duplicates, and that were about the individual (e.g. we excluded responses like “Everyone lacks faith in God”). The recordings were originally in Arabic, and were subsequently translated for use in the project.

Our primary representation of the data set was an Arduino-powered art installation, in which bird-like electromechanical systems were suspended from a structure. We chose the symbol of the bird because of its legible connotations of freedom but also vulnerability. We used a non-human form as a vehicle for the women’s voices in order to universalize the exhibit’s message but also because visual representations of Saudi women are very marked images, which means that an audience might bring a range of biases to the exhibit if faced by such visual signs. The normal flapping of the wings was the invitation for passersby to become audience members. Once a “bird” was approached by the audience member, the flapping would slow and stop, creating a sense of conversation between the audience and the exhibit. The audio recordings, which were the translated responses to the survey question above, were on a continuous loop, creating the feeling that the voices are “always there, you just have to listen”. We purposefully chose the volume of the recordings to be low, in order to invite the audience to listen intently and have a more intimate experience.

The art exhibit was officially held on Monday, May 9th, 2016 in the Design Media Center building lower lobby area of the Massachusetts School of Art and Design campus. We had chirping ambient sound, natural light, and a window background to create a more realistic feel to the “bird” metaphor. The exhibit had two entry points, either a close-by wall where the project was described or the art installation itself.

In addition to our installation, we also created a website and a video (short version, longer version, and associated files) in order to create a digital counterpart to the physical experience of the project. We wanted to create a digital portal that would bring the subject matter out of the restrictions that the physical medium imposes (timeframe, location, etc.) and to a larger audience, especially the Saudi women who can’t physically access the exhibit but are very much a part of it. The article in the website puts the installation in context of the representation of Saudi women in Western media, while also incorporating the burgeoning Saudi art scene and demonstrating how some of the data from the survey might surprise a Western audience. The poem on the website is another literary vehicle for people to interact with the data set (it is made up of the same answers that were used for the “birds”). Finally, we included a video to create a digital version of the exhibit that is a bridge from the physical to the digital, capturing the complexity of the exhibit (sounds, movement, etc.) as completely as possible.

Our impact assessment for the project focused on the art installation itself (it was the primary representation of the data set). For the digital components (website and video) of the project, we didn’t focus on measuring their impact, though methods by which we would do this would range from as simple as number of views (and where the viewers are from, as it would be particularly interesting to see if there are viewers from Saudi Arabia) to gauging the quality of discussions that could arise from comments on those platforms (we are hosting the website on WordPress and the video on Vimeo).

Our audience for this project was Mass Art students and faculty. Our goals for this project were to give voice to Saudi women and to allow Mass Art students and faculty to engage in a conversation around gender equality. Because of our decision to create an art installation that embodies qualitative data, our method for assessing impact consisted of


(1) observing the level of engagement of the audience and

(2) conducting interviews regarding their experience.

Regarding the interaction between the audience and the exhibit, this is what we observed: at first, most people would stand a bit far from the birds until they realized there was audio coming out of them, and then they would come in close and listen. They would then go to the wall, read about the idea behind the project, and subsequently be interviewed and encouraged to answer a set of questions regarding their experience. We received a few mixed responses to the audio component. For example, one of our audience members commented in an interview: “These things talk the moment I leave”. This is representative of the type of conversation “feel” that we purposefully wanted to create: To truly hear these women, you have to have patience and listen intently.

The piece operates as much in the art space as it does in the space around empowerment. For this reason, we also wanted to assess how people responded to the topic of empowerment on a personal level, having literally heard some of the things that Saudi women are lacking that would make them more empowered. For this reason, we asked people to answer one of the questions that Saudi women were called to answer as part of the survey: “What are you currently lacking that would make you more empowered?” Around 15-20 people experienced the installation. We would like to highlight parts of the interviews we conducted:

Interviewee 1

On the experience and what it meant to them: “What struck me about the voices was that it was a different perspective from a different country. Hearing the problems and issues that other people have is very important for other people to hear. I think right now I have a lot of distractions in my life. I think definitely having more focus would help me start working on the things I really want to work on and finding the things that are important. That would give me more control of my life.”

Interviewee 2

On the other groups that face similar issues: Women here definitely work very hard to make a clear statement or make a name for themselves. There was a recent panel here that talked a lot about how a lot of those women had to work harder to make themselves feel as equals to men, and act as equals, as well. They have to be very careful about how they present themselves. I’m not sure if that’s true in Saudi Arabia, but if you’re going to make a giant change, you have to be careful about that giant step because people are going to have a big reaction, so either a slow transition or something that people can relate to is important. We saw that happen in the civil rights movement and the women’s rights movements — it happened over decades.”

Interviewee 3

On the experience: “I wanted to hear all the sounds that they [the birds] were making. It was interesting to hear these viewpoints and struggles. I wanted to hear them all. But sometimes one of them would talk while I was listening to another one. And it was frustrating. The birds seem to be speaking right at the moment I moved away from them.”

On whether he could think of other groups that faced similar issues as Saudi women: ‘Many groups struggle with similar issues to different extents. There are groups that require more respect, more equality more opportunity to accomplish what everyone feels they deserve. I’m sure there’s similar groups.”

Post-it Written Response: “A job.”

Interviewee 4

On the experience: “I like it especially in this weather, when you see the birds next to the glass’. On other groups that faced similar issues: ‘For me, because it was in English, I didn’t connect it just to Saudi women. It’s very hard to connect it only to women: for me, it was about everyone who is oppressed.”

Post-it Written Response: “A good book.”

We learned a huge amount from the interviews about the effectiveness of our installation, which was inherently complex because the artistic nature of the piece, form (aesthetics), function and call to action all affect the experience of the installation. One of the most important takeaways was the importance of designing the experience of the exhibit as a whole (i.e. How do we make sure people follow the route we want them to? What can we do to make the exhibit more “inviting”?). In addition, while we focused many of our efforts on the technological development of the “birds”, we received feedback that the art exhibit component of our project merited more focus on the aesthetic piece. Perhaps the weakest link in our exhibition was the Post-It question component. We think that having a tablet on which people could respond would have potentially been less intimidating. However, this would take away from the public nature of the exhibit, which is predicated on these answers, or voices, being visible to all.

Overall, the goal of giving Saudi women a voice was accomplished through the installation. All persons interviewed were interested in the audio clips playing from the “birds” and wanted to listen to them and learn more about the subject matter. We also believe that our goal  of engaging MassArt students and faculty on a discussion about gender equality and empowerment was accomplished, since audience members engaged with the exhibit and provided interview and Post-It responses after seeing the installation. That almost all of the interviewees were able to relate the Saudi women’s experience to their own lives or to a group in their own country or environment that might be in a similar situation was an indication of our exhibit’s success in pointing to the broader applications of the data set and installation.

For future iterations of this project, we would recommend on improving the material components of the “birds” in order to improve what can be done with regards to function, form, and aesthetics. We would also recommend having a different medium than Post-It notes via which to gather non-interview responses and incite discussion around this topic, whether it is through a digital platform like Medium or directly with the website. Finally, we would recommend putting more emphasis on the exhibit design as a whole, establishing a more specific audience flow and having more purposeful exhibit contact points and milestones throughout. We also think that it would be really powerful to incorporate the audio responses that people provide via interviews into its own “bird” for future exhibits, and grow the conversation past the Saudi Arabian women community to other communities that also want to engage on the topics of gender equality and empowerment.

All in all, we think that this project was an appropriate way to represent our data set. We provided a physical manifestation that led to intimate interactions with our targeted audience and developed discussions around the target topics. We also provided a digital manifestation that extends the reach of our project to a wider audience. Finally, we provided a medium for the Saudi women community to be heard, but didn’t impose any sort of help or hubris on them. We respected their reality, stood in solidarity with them, and started a previously unheard discussion.

Impact of Diversity at MIT: Step Up to the Board

Link to our final project here: Today’s Lecture: Gender Disparity at MIT

Team Members: Kenneth Friedman, Phillip Graham, and Andrew Mikofalvy

After reading through report on The Status of Undergraduate Women at MIT we wanted to share the findings and thereby increase awareness of the problem of gender inequality on campus, and show that the Institute is listening and able to feasibly implement the reports recommendations to help fix these issues. 

Our audience for the final project is the MIT community. Presumably most students hadn’t heard of, or at least read through, the report on The Status of Undergraduate Women at MIT which we feel is helpful in understanding the diversity problem on campus and what MIT can do to solve them.

To gauge the reaction of our intended audience, we created a pre- and post-survey that asked for the user to rate on a scale from 1 to 5, from Strongly Disagree to Strongly Agree, the following two statements:
There is a gender inequality problem at MIT.
Assuming there is a diversity problem at MIT, there are many feasible approaches to solving it.
We feel that these two statements best illustrate the goals of our project as we want our audience to be more aware of gender inequality on campus, through the findings of the report, and to be informed of the recommendations the report found for MIT to solve these issues.

From the pre- and post-surveys we found most of our audience went from disagreeing that gender inequality is an issue on campus to strongly agreeing after going through our final project. Our second question, which discussed the feasibility of solutions to these problems showed an even larger increase in agreement as most our pre-survey responses were strongly disagreeing to agreeing.

We also got incredibly helpful feedback on wording and questions to use by our peers/audience and really appreciated the help.

Biking To A Healthier MIT: Impact

By Eric Lau, Iris Fung, Judy Chang, and Julia Appel

MIT puts student health and wellness at the forefront of much of its community programming. Community Wellness Classes range in topic from exercise and fitness, healthy eating, smoking cessation, stress management, and sexual health; the getfit@mit program encourages exercise via a 12-week team-based exercise challenge. Further, MIT offers a subsidy on Hubway membership for students to the tune of 70% of the total cost. We wanted to think of a way for MIT to publicize both their Hubway subsidy program and the benefits of using Hubway to increase physical activity and save time commuting around the area.  

Our goal with this project is to inform MIT students who are non-bikers and/or non-Hubway members about the benefits of the Hubway bike share program and biking as a form of physical activity, raise awareness about the MIT Hubway subsidy program, and encourage those in the MIT community to join for use as an alternative form of transportation to the T. Using a Hubway bike instead of the T will save the students time commuting, increase physical activity, and promote exercise, health, and wellness. As such, our intended audience is MIT students, or others in the MIT community, and our call to action is for currently unengaged students to join the Hubway bike share program.

Our hope was to evaluate impact of the game by tracking how many students actually used the coupon for a free Hubway (that would be easiest enough to track with access to Hubway data on single day passes). However, due to time constraints we were not able to connect with people who work at Hubway, and so decided to rely on a pre/post survey that we disseminated using Google sheets that asks indicator questions to represent the major goals of our piece. We asked game participants to take a survey before playing the game, and then again after the game happened on the following topics:

  1. General level of physical activity/enjoyment of physical activity
  2. Self-efficacy related to biking, and bike-commuting
  3. Awareness of Hubway bike share program/MIT subsidy program
  4. Likelihood of joining the program within a 10-day period.  

We asked audience members to take a survey before and after watching the video, to gauge the effectiveness of the video in increasing audience knowledge of and excitement for using Hubway in the future.

Feedback:

We received lots of positive and valuable feedback on our project from members of the MIT community who we recruited to game. (See more in our slideshow!) From key informant interviews with those who played the game and watched it being played, we found out that people really enjoyed the physical activity component of the game, learning about the MIT Hubway subsidy program, and some of the public health facts. They also enjoyed cheering for the biker, seeing the biker get the power up boost, and watching the biker complete the race. 80% of people who took the post-game survey said that they would probably take a free Hubway ride if they were given a coupon for one. 60% of players were thinking about or considering joining Hubway, and one rider changed her pre and post survey response, from “I might consider joining Hubway in the next 10 days” to “I will probably join Hubway in the next 10 days”. Some audience members were more interested in the MIT subsidized Hubway membership, which they said they learned about via the facts that pop up on the video.

We also received some unanticipated feedback on the game. First, many players and audience members were actually turned off by the GoPro footage: it was a bit too “real”, as it depicted biking up Mass Ave at rush hour, in the rain. (There were too many near brushes with cars, other cyclists, etc.) One game player said  that the “biking was fun but the traffic is terrifying, which is the main reason I don’t bike now.” To our dismay, biking self-efficacy did not increase as we’d expected, but rather decreased! The second piece of valuable feedback we received was to edit out those parts of the video where the person was stopped at a light, so the bike motion was continuous the entire time. We also received feedback on the physical bike stand setup: namely, that it incorporate some form of resistance in pedaling, so that the simulation is a bit more “real life.” Finally, we were told that having a leader board might encourage even more friendly competition among players.

With more time and resources, we would love to refilm the GoPro video, build a more realistic bike stand that incorporates resistance, and also build in the leaderboard component. Overall, though the audience and game players seemed to enjoy the game very much, especially the audience interaction and support pieces. They also took away valuable information about the MIT Hubway subsidy program, and the health benefits of biking, which were two of our main objectives with this piece. We are confident that, with a few tweaks and possibly a Hubway partnership, our game would be a big success.

Will you join us in biking to a healthier MIT?

Biking To A Healthier MIT: Methodology

By Eric Lau, Iris Fung, Judy Chang, and Julia Appel

Biking to a Healthier MIT draws on ideas generated during the participatory data games and maps/creative maps sketch projects. We began using data from Hubway, which lists the starting point, terminus, and length of every Hubway ride between April 2011 and November 2013, and analyzed routes that are frequently traveled by people from the Hubway station at the corner of Mass. Ave and Amherst St., right in front of 77 Mass Ave. We chose that station to maximize relevancy to our intended audience: the MIT community.  We analyzed length of frequently traveled routes from that station, and chose one of the most frequently traveled routes in each direction: northwestern to Harvard Square, and southeastern to Boston Commons. As mentioned, we chose two routes that were similar in distance (each about 2 miles from the starting point), and had similar projected average travel times on public transportation (Google maps estimates 13 minutes on the number 1 bus to Harvard Square, and 16 minutes to Boston Commons using the number 1 bus and Green Line D extension from Hynes Convention Center). Out of 33,685 rides taken from the Hubway terminal in front of Mass Ave, 2,419 were taken to the 5 Hubway terminals in and around Harvard Square, and 969 to the four in and around Boston Commons.

Northern Route to Harvard Square. (Pins represent Hubway terminals.)

Screen Shot 2016-05-08 at 5.09.06 PM

Southern Route to Boston Commons. (Pins represent Hubway terminals.)

Screen Shot 2016-05-08 at 5.14.27 PM

The game is designed to promote physical activity, increase excitement for and awareness of MIT’s Hubway subsidy program, and encourage audience participation among people watching. A stationary Hubway bike – an actual Hubway bike on a stand we built –  is set up in the second floor lobby of 77 Mass Ave. A poster hanging on the wall behind the bike read: “Can You Beat the T? Hop On!”, and prompts the rider to begin pedaling to start the game. The user enters their email address, chooses either the Northern or Southern route, and beings pedaling. Then, a GoPro video begins playing with footage of a bike trip along the chosen route, and a map pops up on the side of the page showing the precise location of the biker. Faster pedaling corresponds to speeding up in the game: the video plays more quickly, and the icon on the map moves more quickly. If you complete the route, you win the game! The user has the actual experience of biking – they are pedaling the bike and the GoPro video shows an actual bike ride along the route they chose – and gets the physical benefits of spending 4-5 minutes doing vigorous physical activity. The rider then receives an email with information about their ride: its duration, distance, average speed, and calories burned.  

The game is also built to encourage audience interaction and participation: as the person is riding the stationary bike, facts about the benefits of Hubway pop up on the screen (i.e. it increases physical activity, and saves time and money).  (For a complete list of facts that show up during the game, click here.)  Also, a sign to cheer for the person on the bike appears on the screen; if the audience cheers loudly enough, then the rider receives a “turbo boost”, goes more quickly, and is more likely to finish and win the game.

We felt it was important to simulate reality as much as possible and create a truly immersive user experience. To that end, we use an actual Hubway bike and several data streams – GoPro footage from the selected ride, computer vision speed inputs, and audience noise levels. There are several feedback loops built into the game, from the speed of pedaling to the noise level of the audience affecting the speed of the video and what is shown on the screen. The game incorporates several components and frameworks, including d3.js, Popcorn.js, OpenCV, and PyAudio. The multiple levels of user-controlled feedback create a dynamic experience where everybody – from the rider to the audience members – join in a collaborative, interactive journey and living story of biking to a healthier MIT.

Here is a link to a slideshow (with lots of pictures!) that details our methodology, and includes video footage of the game being played.

Affluent White Bostonians Unfairly Targeted by Stop and Frisk Practices…Mostly While Leaving SoulCycle

Team members: Catherine Caruso, Kendra Pierre-Louis, Tiffany Wang
Download Class Presentation

Screen capture from the satire website The Olive
Screen shot from the website that we developed for this project

Methodology

This project builds on a previous project that combined a satirical Onion-style article with a fake map. Now, our piece appears on our own satirical website, The Olive, a nod to the real satirical website, The Onion. The satirical main text is annotated using Genius with real facts about stop and frisk practices in Boston.  It also includes a map that toggles back and forth between the real data and the satirical data. At the bottom of the article we include an explicit call to action, and a number of different options for learning more and getting involved.

We wanted to see if satire could be used to both inform, i.e. like real news, as well as possibly affect behavior.

The main dataset used in this report is used the Stop and Frisk (FIO) dataset that the Boston Police Department released after being sued by the American Civil Liberties Union (ACLU). Catherine D’Ignazio provided us with a geocoded version of the dataset that we used to create maps. The data indicate that the areas with the highest density of stop and frisk incidents are also the areas with more people of color, and most people that are targeted by stop and frisks are black men. We also used US Census data to provide the community descriptors – median incomes, and racial demographics – of the communities mentioned in the article (both the satirical data and the real data), along with Catherine’s extensive knowledge of Gisele Bündchen and Tom Brady.

The website is hosted by GitHub and was created in Jekyll. The annotations were created in Genius, and draw from a combination of the ACLU report, Census dta, and the actual stop and frisk dataset. The satirical article includes the same stop and frisk statistics, but flips them so they apply to affluent, white citizens in Brookline and Milton. It also cites general race and income information for those neighborhoods. To avoid copyrighting issues, we included a photo of Gisele that is available for public use and photos of friends who agreed to be photographed for this project.

For the maps, we used cartoDB’s density map function to show the density of stop and frisk incidents happening in the areas around Boston. The density map split the data into seven different bins. In cartoDB, we altered the code to change the color scheme (cartoDB only has one inverted color scheme, which is from white to pink). We also created a manipulated map, where we flipped the color scheme, and used PowerPoint to add stop and frisk incidents to the Brookline and Milton areas. We used JuxtaposeJS to create a map with a slider that moves between the actual and manipulated versions.

To assess the efficacy of the website, we did a series of five informational interviews with people. In all of the interviews we asked a pre-question: ”

On a scale of 1-5,  with 1 being the least, and 5 being the most, how much do you know about stop and frisk practices in Boston?

If the respondent said three or higher, we followed up with the question:

On the same scale of 1-5, how problematic are current stop and frisk practices in Boston?

Then the interviewee would go through the website. We used a screen recording the website to see how the reader’s engaged with the website. Afterwards we asked them a series of informational questions:

  • How did this piece make you feel? (prompting questions if respondent asked for clarification: Did you think it was entertaining? Did you think it was surprising?)
  • What was your overall reaction to this piece?
  • How did the balance of humor and real facts work for you?
  • Did you notice the annotations and click on them while you were reading?
  • Could you tell the difference between the joke data and the real data?
  • Did you trust the real data?
  • Do you feel motivated to do something about this problem?
  • Which action at the bottom would you be most likely to take?
  • Did this article change your opinion of stop and frisk practices in Boston?

As a final information gathering mechanism, we installed google analytics on the site to track visitor behavior.

Sample of the Google analytics.

Once the site was completed, we encouraged people in our network – via email, facebook, and twitter – with connections to the Boston area to read the site. Some of the tweets used bitly to further allow for additional engagement tracking.

Goals & Audience

According to the ACLU, current stop and frisk practices in Boston are highly problematic-they disproportionately target people of color in low income neighborhoods. In fact, many people in these neighborhoods are subjected to so many stop and frisks that their daily lives are disrupted. Rather, than replicate them here below, you can find the complete statistics about stop and frisk practices in Boston in the annotation layer of our article.

Unfortunately, the individuals that are subjected to unfair stop and frisk practices often struggle to have their opinions heard by those in positions of political power who can actually change these practices.

Our goal with this project is to educate more people about stop and frisk practices in Boston. Specifically, we want to target people who have not been subjected to stop and frisk practices, and have not experienced racial or socioeconomic discrimination from law enforcement firsthand. In Boston, this includes middle to upper class Bostonians, many of them white, who may recognize the term stop and frisk, but know very little about whether or not it is a problematic practice. Because of their affluence, race, and status, people in this demographic tend to be in a greater position of power to bring about political change that can improve the situation.

To accomplish this goal, we wrote a satirical article that blends a light hearted, humorous fake news story with the facts about stop and frisk practices in Boston. We chose to incorporate the facts into the article as an annotation layer, where the reader can access them as pop-ups while moving through the article. The map toggles back and forth between a manipulated version that matches the satirical content of the article (where most stop and frisk incidents occur in Brookline and Milton MA) as neighborhoods with high numbers of stop and frisk incidents), and the real data (where stop and frisk incidents are concentrated in Dorchester and Roxbury, MA). The article appears on The Olive, a website we built that is targeted at the middle to upper class, white Bostonians that we want to educate about stop and frisk.

We used humor in our article as a strategy for achieving a higher level of engagement with our audience, and making readers more open and receptive to learning about the many issues with stop and frisk practices in Boston. We wanted to draw in readers that might not choose to read a serious article about stop and frisk, but would be willing to learn about it within the context of satire, and are in a position to actually do something about it. Finally, in the call to action section, we also took advantage of the personal story: although we were unable to interview someone directly for the development of the site, we embedded a video the ACLU of Boston did that told the story of Ivan, a Boston resident who has been stopped more than 30 times.

We also offer readers a number of options for taking action on this issue, ranging from the simplest (sharing the article on Facebook or reading more about it) to more involved (donating to the ACLU or signing a petition to Mayor Marty Walsh). We hoped that by offering so many options for taking action, we would encourage readers to engage at whatever level suits them.

Project Assessment

To assess our project, we conducted five semi-structured interviews with undergraduate students at MIT (in an ideal world, we would interview people in our target demographic, but within the constraints of this project, we went with who was available). Our readers included two white students and three asian students. Overall, most of our readers recognized the term stop and frisk, and knew what it was, but did not know any statistics about it.

Several of our readers laughed out loud while making their way through the article, and enjoyed the humor of the satire. Others did not find the article humorous, particularly those that weren’t familiar with SoulCycle. This dichotomy of reactions emphasized that humor is highly subjective, and challenging to use effectively for the purpose of appealing to a broad audience. Again, interviews with people in our target demographic would give us a better sense of whether or not the humor works within our target context.

One technical issue we encountered is that our subjects did not realize the highlighted portions had pop-up statistics associated them, and read the article without clicking on them. With more time and technical resources, we would either make the statistics so they popped up when the mouse hovered over the text, or have the first statistic pop up automatically to make readers aware of the annotation layer.

It is always difficult to get readers to actually take action after reading an article, but our strategy of offering different options seemed to work-our readers were diverse in action they were willing to take action: two said they would sign a position, two said they would read more information, one said she would like the BLM Facebook group.

Impact of “What Should You Eat?”

Team Members: Gary Burnett, Jane Coffrin, and Michelle Thomas

Check Out Our Presentation Here

One fourth of produce is wasted before it reaches a grocery store due to visual imperfections. Meanwhile, 11.4% percent of households in Massachusetts are food insecure. And the food they have the hardest time providing for their families? Fruits and vegetables. Organizations like Food for Free and Boston Area Gleaners help to rescue this ugly produce and get it to households who need it. Recently, Whole Foods joined the cause and has started selling ugly produce in some California stores, if sales go well they will sell ugly produce in all locations. Many people don’t know about the existence of ugly produce and the waste that goes along with it. We want to raise awareness, as well as encourage the participation and sale of ugly produce through changing the stigma around it.

We created a custom 52-card deck to expose the high visual standards for produce given by the USDA. With this deck, we are targeting families with children. The deck includes instructions for 3 games that can be used with the cards. Memory, Go Fish, and Spoons were selected because they appeal to a larger age range of children as well as a matching as the component. Through testing we found that teenagers care less about the visual appearance of their produce than the adults in their lives. Children tend to grab the first apple they see, whereas their parents will sort through a pile of apples to find the most visually appealing one.

We started by showing our initial sketch (just a memory game) to Sam Liberty from the Emerson Game Lab. He suggested that we eliminate the factual text from the cards, as people are unlikely to read it while playing, and that we add the option to play other matching based games such as Go Fish and Rummy. From his suggestions we removed the text, only leaving the name of the fruit or vegetable on the card. We also increased the number of cards we had from 16 (8 pairs) to a full deck of cards 52 (13 sets of 4) providing one visually perfect item and 3 variations of its ugly counterparts. After we made these changes we met with the Green Team, a group of high schoolers, from Groundwork Somerville. We played Memory, Go Fish, and Spoons with them. Spoons was by far the favorite for these students, they enjoyed both playing and cheering their group members on once they had been eliminated.  After playing with them, we found that: they liked the labels, they wanted a clearer distinction between the “perfect” produce and the “ugly” produce, and they wanted more information on how they could help. All of the students were surprised to learn that 26% percent of produce is wasted just do to visual appearance. From their comments, we have decided to include extra cards that provide more information such as facts and how they can help as well as added a golden border to distinguish the perfect and ugly produce.


Methodology Behind “What Should You Eat?”

Team Members: Gary Burnett, Jane Coffrin, and Michelle Thomas

Check Out Our Presentation Here

We decided to look into the Food for Free data that was provided to the class. None of us had used this data set for previous projects, so we didn’t know what to expect. After looking through the data we found that 1 in 9 people in Massachusetts are food insecure. We also noticed that while the majority of the comments collected were thanking Food For Free for providing fresh produce, it was the only item that the organization had to spend money purchasing rather than receiving enough in donations. So, we turned to the internet to learn about food insecurity and find a story. From searches, we found EndFoodWaste.org learned about ugly produce. Ugly produce are fruits and vegetables with visual imperfections that taste the same, but are not sold in many grocery stores due to appearance. The reality is, one fourth of produce is wasted before it even reaches the store. Most of this waste is due to visual imperfections. In fact, according to the National Resources Defense Council (NRDC), 52% of all produce is wasted in North America. With all this food waste, you’d think everyone was getting the produce that they need, but according to the Food for Free data, produce is the number one needed and desired food for those who receive donations. Groups like Boston Area Gleaners and Food for Free are rescuing ugly produce and getting it to those who are food insecure.

Most people are unaware of both the amount of produce wasted and the existence of ugly fruits and vegetables. We wanted to tell a story to encourage the sale and purchase of ugly produce. Who decides what qualifies as ugly produce? It turns out the USDA offers Grade Standards for produce based on visual appearance. While these standards are just guidelines, they have been closely followed by the grocery stores who hold the produce they purchase to these high standards. We sorted through the visual guidelines for fruits and vegetables and selected the standards that were only cosmetic (and wouldn’t impact health if consumed). For example, tomatoes with green on them have the potential to be harmful if consumed and aren’t just visually less appealing.

Recently, Whole Foods has started selling ugly produce in some of its California stores at discounted rates (source). If it is successful in California they will start selling ugly produce at all their stores. Knowing Whole Foods was trying to start selling ugly produce, we decided to pretend we were Whole Foods and make an interactive game that could be used and given away at EarthFest. EarthFest is a concert festival in Boston to promote reducing the environmental impact, it is put on by the 92.9 radio station and Whole Foods. We would set up by the Kids Planet stage in order to reach our target audience of families with children (6-18). In making the game we used the USDA visual guidelines to depict food that is grade “U.S. Fancy”, or the highest visual standard, and have kids match them up to food that is graded not fit to sell.


Impact of UglyFruit

View our infographic (use Google Chrome for best results)

Our main goal of this project was to convey how sizable of a problem hunger in this country is, and how food waste, which is also a huge problem which we all contribute to, is a possible solution to the problem. We want viewers to understand that while we, as individuals, waste a lot of food, grocery stores are also a big contributor to this problem. Lastly, we want viewers to understand that there are things that can be done about this, which are listed in our call to action section.

Our audience for this project is general American consumers, that are likely unfamiliar with food waste as an important issue and big problem. This is pretty broad but since almost everyone buy food, cooks food and eats food, this is relevant to everyone. Our intention is that this story would be put out by an organization such as Food for Free and their audience is the average, curious bystander who thinks the infographic looks cool so they make the decision to read through it.

The actions that we want viewers to take after viewing the infographic is: donating to Food for Free, signing the petition for the Food Waste Recovery Act, and pledging to stop overshopping.

While assessing the impact of our project, the first thing we asked our interviewees before they viewed the infographic, was the following: How many people do you think face food insecurity in the U.S.? How much food is wasted in the U.S.? While some interviewees had guesses much lower than the actual numbers, many were already familiar with this issue and guessed relatively accurate numbers, or numbers even higher than the actual amount.

For the people who were less familiar on the topic, the infographic did inform them of new information. When realizing that 40% of food is wasted, one person said “That’s a lot of food, it makes me feel bad” and another said “the growing image of the pile of food is memorable”. When asked what kind of changes they would make, one said, “I should try to plan more before going to the supermarket”, and another said “I’ll think about buying ugly fruit but then I think my kids probably wouldn’t eat it”. They also all said they would sign the petition.

For the people who were already familiar with the topic, the infographic did not have as much of an impact on them. They mostly were not surprised by the 45 million and 40% numbers, some even thought they seemed low. When asked what kind of actions they would take, they did not think signing the petition would be useful. One mentioned “legislation is the way to cause change, signing a petition won’t have any effect”, and another said “petitions don’t usually do anything, but if I was voting on something to donate food, I would”. Another interviewee added in context to ugly fruit, that she thinks “Americans are way too obsessed with aesthetics, Europeans are much better about it”.

Overall, it appears that our call to actions were not too successful. It seems like most viewers would not continue to do them. Our infographic, however, did engage the viewers. They read it to completion and seemed interested throughout. For the people already familiar with the issue, it does not seem like it will have much of any impact. However, for the people who were not, the infographic will at least be memorable to them, which will make them more aware of the problem in the future. Ideally, it could make sense to narrow down our audience to people less familiar with this issue, however there are difficulties with targeting that specific group.

Methodology of UglyFruit

View our infographic (use Google Chrome for best results)

We originally wanted to work with homelessness data again after the 5th mini-project due to the large quantity of data and relative cleanness, but could not find a concrete call-to-action to frame our story around. We brainstormed some alternative ideas; the strongest alternative was to tackle childhood obesity by drawing on CDC data, with a call to action of either encouraging kids to write letters to “Save Recess!”, or to help parents encourage their kids to play outside more. However, the CDC data was not available as a raw dataset, but only as already-prepared charts and graphs, and we also felt that the split audience of parents and kids would make it hard to find the appropriate tone for the project.

We pivoted to a project tackling hunger in America, drawing on data from Project Bread and the US Department of Agriculture, with a focus on reducing food waste using data from Food for Free. Since we were creating a webpage with a strong emphasis on narrative flow as opposed to hard statistics, we were able to concentrate on finding fewer, more salient numbers which most strongly supported our story (did you know that 40% of food in America goes uneaten or is otherwise wasted?), and back them up with graphics and animation. We also focused on looking for summary statistics that were pre-aggregated, as opposed to breakdowns along any dimension, to highlight that fact that this is a national problem; this meant very little data cleaning was necessary. The most difficult part of the data-gathering process was not finding appropriate statistics, but picking the most relevant portions. Because we had two main focuses (hunger and food waste), we first searched for multiple sources and datasets for each topic and collected them in a shared document. We then looked to focus our argument based on the data we had available; there is a wealth of information available on these large and complex problems, but with a fairly broad audience we needed to use numbers that brought the issues of hunger and waste to life without including too much. Another challenge was juxtaposing the hunger and waste data into a coherent narrative; we decided to open by introducing the immediate problem of hunger with some statistics as hooks, then pivot to food waste and a breakdown of the different ways it occurs.

One important technique that we wanted to incorporate was personal stories; we collected quotes from sources such as the Project Bread status reports in order to weave them into the narrative. However, we ultimately took the project in a slightly different direction of focusing on reducing food waste as a solution to hunger, and less on the problem of hunger itself, so we decided not to incorporate quotes about hunger. However, we did include a quote from the former President of Trader Joe’s about food waste in grocery stores, which helped add a more real-life connection to our website.

Sources

Methodology for Diversity at MIT: Step Up to the Board

Link to our final project here: Today’s Lecture: Gender Disparity at MIT

Team Members: Kenneth Friedman, Phillip Graham, and Andrew Mikofalvy

How we found our data:

Our group was interested in finding a dataset that related to education and academia. We decided to focus on MIT and found two reports that interested us:
A Study on the Status of Women Faculty in Science at MIT – Written in 1999
Which discussed the lack of women faculty in the Department of Science at the time (Around 8% for 10-20 years), gender discrimination with space, resources, equipment, and more, and the actions the Dean of MIT took to address these issues.
The Status of Undergraduate Women at MIT – Released by Caroline Chin and Kamilla Tekiela in February of 2016
Which discusses in great detail data collected through several surveys conducted by the MIT Office of Institutional Research, several campus focus groups, and the support of many more, which showed gender discrimination on campus today and recommendations to fix these issues moving forward.

How we cleaned it:

Data in The Status of Undergraduate Women at MIT report took the form of tables of questions from surveys and their resulting responses, graphs, and charts (one of which we had to extrapolate our data from).
For example:

How we analyzed it:

We analyzed the data by comparing survey answers between men and women looking for significant differences in responses, and compared a graph that shows the percentage of women faculty and undergraduate women over the past decade to the actual 50% of the population being women.

How we synthesized it into a story:

After reading through the 70 page report, our group decided to create an interactive exploration of the data in the report to show the issues associated with the lack of diversity on campus and gender discrimination.
The report on Undergraduate Women at MIT separates the findings into 3 categories:
Academics and Leadership, Environment, and Confidence and Stress.
We decided to have our audience answer three questions in the form of interactive visuals, by using one question and result from each category. We chose one from each category to show the breadth of gender inequality covered in the report.
This design decision was inspired by You Draw It by The New York Times to allow our audience to use their best judgement to guess at what the results of the survey showed. Then the user is shown the results of said survey so that the audience can compare their answer.
After seeing the each result, a corresponding recommendation is shown on what MIT can do to help solve the issue in the question.
For example, closer relationships with advisors can be advisor/advisee dinners hosted by the department.
Our story closes with our Call to Action being, we invite the audience to write a note to MIT’s new Vice President for Student Life, Suzy Nelson, discussing gender discrimination the audience may have either noticed previously or become aware of due to our project, and suggest her to look into the recommendations in the report on Undergraduate Women at MIT.
Another design decision we made was to use the Blackboard as the basis for our interactive visual. The academic tone it sets, alongside the title, is supposed to feel like an interactive lecture, similar to solving problems in MIT classes that are TEAL (Technology Enabled Active Learning) where students are writing on boards to solve problems during lecture. We wanted our audience to feel like they are participating in solving these issues on campus.

Gender Disparity at MIT